
Facebook Ads Cost in Malaysia (2026)
What Facebook ads really cost in Malaysia: the RM ranges local agencies publish and how much weight to give them, how Meta's auction sets prices, dated CPM and CPC benchmarks, and how to size a budget in ringgit.
Updated July 2026 · Xanny Lee, CEO

Facebook ads in Malaysia have no fixed price. You set your own daily budget in RM inside Meta Ads Manager, and an auction decides what each click or sale costs, so spend can start from a few ringgit a day. Instagram ads use the same auction. Meta publishes no Malaysian rate card and no neutral third party measures a Malaysian CPM, so the ringgit ranges local agencies publish (roughly RM0.30 to RM5.00 a click and RM8 to RM50 per thousand impressions, across guides dated 2025 to 2026) are practitioner estimates from their own client books, useful as a sanity band and not as a forecast. The only dated measured benchmarks are US figures (a $0.70 traffic CPC and a $27.66 cost per lead in 2025, per WordStream), which show how cost behaves rather than your local price. Your real cost depends on your objective, your category, the season (auctions tighten before Raya and around 11.11), your bid strategy, and above all your creative, all read from your own Ads Manager.
You have a product, a Page, and a number in your head, and every article you open gives a different answer to what Facebook ads cost in Malaysia. Some quote US dollar averages, some quote RM figures with no source attached, and none of them match what your Ads Manager shows. Here is the honest version: Meta does not sell ad space at a fixed rate, it auctions it, so nobody can quote your price in advance. But you can understand exactly what moves that price, see what the credible dated data actually says, and set a budget that surfaces your real number within two weeks.
Facebook ads price: a budget you set, a rate the auction sets
Meta does not sell advertising at a fixed rate, in Malaysia or anywhere else. You tell Ads Manager what you are willing to spend, a daily or lifetime budget set in ringgit that Meta bills with 8% SST added on top, and the auction decides what each result costs. The technical minimum per ad set is small (Ads Manager shows the exact RM floor as you type), so the practical question is never what Facebook charges. It is what a click, a lead, or a purchase costs you, and that number is discovered, not quoted.
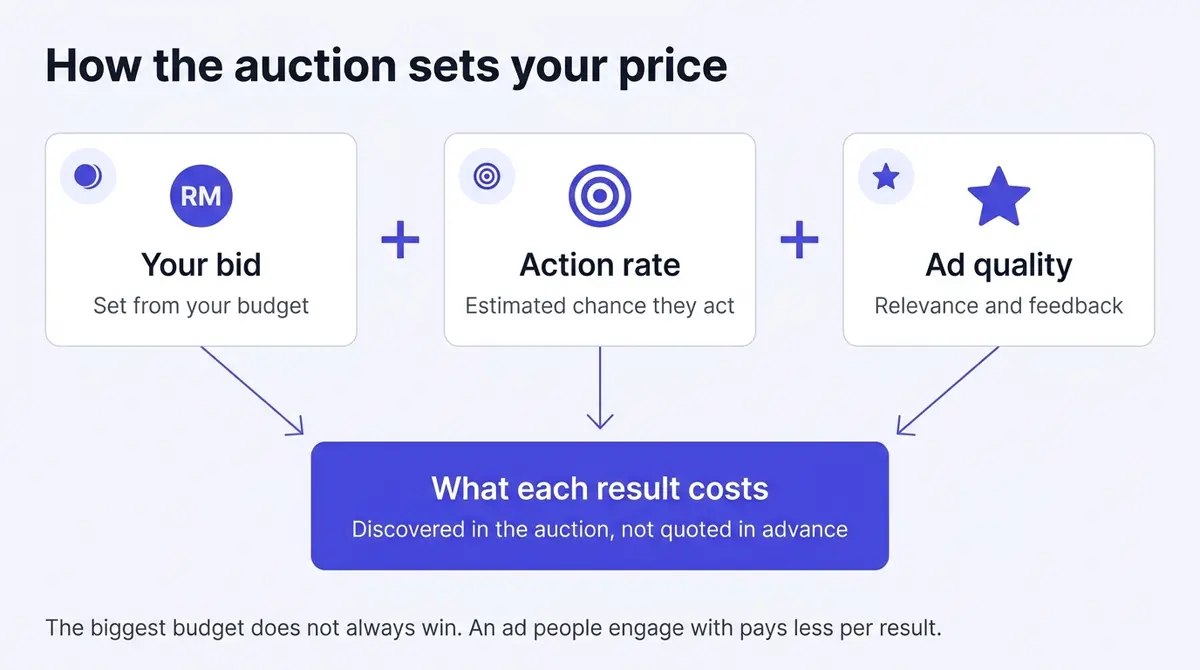
The discovery happens in an auction that runs every time an ad slot opens. Meta weighs three things: the bid (for most advertisers, set automatically from the budget), the estimated likelihood this person takes your optimized action, and the ad's quality. The biggest budget does not automatically win; an ad people actually engage with can beat a richer competitor and pay less per result. So nobody can promise a price in advance, and creative quality is not a soft factor: the auction prices it on every single impression.
Your three cost numbers, and what the dated benchmarks say
Before any benchmark means anything, read your own report. Three figures sit at the centre of it, all from the same spend column.
| Metric | What it measures | Formula | Worked example |
|---|---|---|---|
| CPM | Cost per 1,000 impressions | (spend / impressions) x 1,000 | RM50 / 8,000 x 1,000 = RM6.25 |
| CPC | Cost per link click | spend / clicks | RM50 / 200 = RM0.25 |
| CPA (cost per result) | Cost per purchase, lead, or optimized action | spend / results | RM50 / 4 purchases = RM12.50 |
They move together but not in lockstep: a high CPM with a healthy CPA is fine, while a low CPM with a runaway CPA means cheap reach that does not convert, which is the problem the rest of this article is about.
With your own numbers framed, the published benchmarks become useful as context rather than a target. Credible, dated figures exist, but read their labels before borrowing them. WordStream's 2025 benchmark study, built on US campaigns from April 2024 to June 2025, put the average traffic-campaign CPC at $0.70, with lead campaigns averaging $1.92. Search Engine Land, on the same dataset in September 2025, flagged the sharper movement underneath: Facebook's average cost per lead climbed 21 percent year over year to $27.66, even as traffic clicks got slightly cheaper. Shopify, publishing at the end of November 2025, put the average CPM at $16.06 and the average CPC at $0.87 for that month.
Read those labels twice, because all three are US figures in US dollars. They tell you the shape of Facebook costs, not your Malaysian price, and as the next section shows, the local rate sits well below the US one. Use the US data to understand which way cost moves, never to predict your own number.
What Facebook ads actually cost in Malaysia (the honest country picture)
For years the honest answer to "what is the Malaysian rate" was a flat "nobody measures one," and that is still the most accurate one going. Meta prints no per-country rate card. No neutral third party tracks a Malaysian CPM or CPC the way WordStream and Shopify track the US, so there is no dated outside number to anchor your local cost to, and the RM tables that circulate on local marketing blogs are dated but not sourced: nothing you can inspect sits behind them. Anyone quoting you a precise Malaysian CPM is estimating, not measuring.
What is established, and worth holding onto, is the direction. Malaysian CPMs sit below the expensive Western markets because the auction here has fewer advertisers bidding in a lower-spend market, so each thousand impressions clears cheaper than it does in the US. That is why an imported US benchmark, like Shopify's $16.06 November 2025 CPM, overstates your cost before you spend a ringgit: it is the price of a denser, pricier auction than yours. Treat the US figures as a one-way sanity check (your CPM should land well under them, not near them), and treat your own report as the only rate that is actually yours.
The scale of the opportunity, on the other hand, is measured and neutral. DataReportal's Digital 2026 report counts Facebook's ad reach here at 23.0 million people, inside 30.7 million active social media identities, 85.0 percent of the population as of October 2025, and Facebook alone reaches 86.4 percent of Malaysian adults aged 18 and over. So the audience is real and enormous, the cost per impression to reach it runs below Western levels, and the one number that matters (your cost per result) is the one only your own Ads Manager can hand you.
The RM ranges Malaysian agencies publish, and what they are worth
None of which stops the question being answered elsewhere. Search it from Malaysia and most of what comes back is cost guides from local agencies and freelance media buyers, and they do quote ringgit. You will meet those figures whether or not this page mentions them, so here is the spread across three of the most visible, each with the date it carries.
| Published by | Dated | CPC quoted | CPM quoted |
|---|---|---|---|
| MediaPlus Digital | January 2026 | RM0.40 to RM3.00 | RM8 to RM25 |
| OpenMinds Resources | July 2026 | RM0.30 to RM3.00 | RM8 to RM35 |
| Iffah Ishak | March 2025 | RM0.50 to RM5.00 | RM10 to RM50 |
Read down the CPM column, because the disagreement is the finding. The ceiling moves from RM25 to RM35 to RM50 across three guides published within sixteen months of one another, a factor of two on the exact number the reader came for. None of the three rests on a dataset anyone can inspect. MediaPlus Digital says as much on the page, calling its own figures "illustrative benchmark ranges compiled from Malaysian agency data". Iffah Ishak gives hers as estimates and names no source. OpenMinds Resources does carry a source list, and it points at other published guides rather than at accounts.
That is not a scandal, it is what the category is. These are practitioner estimates: the bands a team has watched go past in its own client book, written down honestly enough. Real knowledge, and genuinely useful. Also unauditable by construction, because a range you cannot trace to a dataset cannot be checked, and it quietly carries whatever mix of industries, budgets, and years that particular book happens to hold. An agency whose clients are property developers and insurers will quote a higher floor than one running cafes, and both are telling the truth about what they have seen.
So give them the weight you would give a good answer over coffee: an order-of-magnitude check, never a forecast. A CPM of RM12 in your account sits inside every band above, which settles nothing except that nothing is broken, and leaves the only question that was ever real, whether your cost per result clears your margin. A CPM of RM90 is a signal worth chasing, and it usually points at a very narrow audience, a peak week, or a below-average quality ranking. Between those two poles a published range cannot help you, because your category, your season, and your creative move your number further than any two of these guides differ from each other.
One line in these guides is worth pulling apart before you budget against it. The monthly tiers often bundle ad spend together with the agency's own management fee. MediaPlus Digital's January 2026 tiers run RM2,300 to RM4,800 for a small local test and RM4,500 to RM11,500 for a growing SME, with management quoted separately at RM1,500 to RM5,000 a month. If you are running the ads yourself, the number you need to budget is the spend alone, and the tier you are reading is not it.
That management fee has its own published spread, and it disagrees with itself in the same way the CPM column above does: the floors quoted across Malaysian providers differ by several times over, and every one of them is quoted by a party selling the service. That is a separate question from what the media costs, so it has a separate page. If what you are pricing is the fee rather than the spend, read what Malaysian agencies charge to run Meta ads, which sets the published bands side by side with their dates.
Cost by objective: an awareness CPM and a purchase CPA are not the same number
The single biggest reason two Malaysian advertisers quote wildly different "Facebook costs" is that they optimized for different things. What you ask the auction to deliver decides which cost metric even applies, and those metrics are not interchangeable. The same US dataset makes the gap concrete.
| Campaign objective | What you optimize for | The cost metric that matters | US reference figure (verify independently) |
|---|---|---|---|
| Awareness / reach | Impressions to as many people as possible | CPM (cost per 1,000) | $16.06 average CPM, Nov 2025 (Shopify) |
| Traffic | Link clicks to your site | CPC (cost per click) | $0.70 average traffic CPC, 2025 (WordStream) |
| Leads | Form fills or messages | CPL (cost per lead) | $27.66 average CPL, $1.92 lead CPC, 2025 (WordStream) |
| Sales | Purchases on your store | CPA (cost per purchase) and ROAS | No single neutral average; read your own |
The lesson is in the spread. A traffic click averaged $0.70 in the US data while a lead click in the same study averaged $1.92, nearly three times more, because the auction is optimizing toward a harder, higher-intent action. A Malaysian store optimizing a cold audience straight for purchases is asking for the hardest action of all, and it pays a different shape of cost than one optimizing for landing-page views or add-to-carts. So a "cheap CPC" you read about is usually a traffic number, and your purchase campaign will quote a CPA that looks nothing like it. Match the benchmark to the objective, and budget in ringgit against the metric your objective actually produces.
Cost by vertical: the gradient survives translation to Malaysian categories
Category is the next big swing. Some products are simply more expensive to advertise because more sellers compete for the same buyer and each buyer is worth more. The absolute numbers below are US dollars and will not be your ringgit price, but the relative ladder, which category costs many times more than another, holds up across markets. Map your store onto the closest row and read the gradient, not the figure.
| US vertical (WordStream 2025, verify independently) | Cost per lead | Closest Malaysian seller category |
|---|---|---|
| Dentists & Dental Services | $76.71 | Clinics, dental, aesthetics |
| Health & Fitness | $52.98 | Supplements, gyms, wellness |
| Beauty & Personal Care | $51.42 | Skincare, cosmetics, haircare |
| Home & Home Improvement | $41.26 | Home, renovation, furnishing |
| Furniture | $40.04 | Furniture, home decor |
| Personal Services | $30.57 | Salons, services, classes |
| Sports & Recreation | $19.30 | Activewear, sports gear |
| Real Estate | $16.61 | Property, agents, developers |
| Restaurants & Food | $3.16 | F&B, cafes, food delivery |
A few things travel cleanly. High-value, regulated, or trust-heavy categories (dental and clinics, supplements, beauty) sit at the top, because the buyer is worth a lot and many advertisers chase the same person. F&B sits far cheaper per lead, which fits the Malaysian feed: a cafe or a kuih seller fills a form or starts a WhatsApp chat for a fraction of what a clinic pays. Lead clicks follow the same order, with US dental lead clicks near $9.78 and beauty near $3.06 against shopping traffic clicks near $0.34. So if you sell skincare, modest fashion, or supplements, expect a denser auction than a niche store, and judge your cost against your own margin, not against the F&B seller down the feed paying a tenth of what you do.
How crowded your category is, before you price it
That ladder is a US ladder, and it cannot tell you how many Malaysian advertisers are standing in your particular auction. The headcount is the pressure on your CPM before any of your own choices touch it, and while the cost here is not measured, the crowd is. Our own study of 679,800 Malaysian Facebook and Instagram ads records what each advertiser runs: the category, the format, the angle it leads with, and how long it stays live. It holds no spend, no CPM, and no return, because Meta does not expose those in the public library. So it prices nothing. It tells you who you are bidding against, category by category, which is the half of the question a benchmark table has never answered.
Three readings change how you handle any published range. Beauty and personal care is the most-advertised category in the country, tagged on about 1 in 5 Malaysian ads (20 percent), with consumer goods at 18 percent and healthcare at 14 percent (AdPlay.ai analysis, 2026). That is the US cost ladder arriving by a different road: the categories that cost the most per lead are the ones with the most advertisers in them, and here the concentration is countable rather than assumed. If you sell skincare in Malaysia, you are not entering an average auction, you are entering the busiest one in the market, and no range averaged across every category is describing your situation.
Second, the feed is offer-led. Nearly a third of the ads in that same study, 31 percent, open on a discount or an offer, ahead of feature callouts at 27 percent. When that much of the auction leads with price, matching the offer buys parity rather than advantage, and parity in a crowded category is what an expensive CPM feels like from the inside. The lever is the angle, not the discount.
Third, and the reason to distrust any tidy annual average: creative here churns fast. About 18 percent of the archive has run past 90 days and fewer than 1 percent past a year (AdPlay.ai analysis, 2026). A "typical Malaysian CPC" is therefore an average over ads that have mostly already been switched off. Your own cost from two months ago beats a published range from last year, every time. Read the full breakdown of what Malaysian advertisers run as the competitive picture to check before you set a budget, never as a price list, because it does not contain one.
Instagram ads cost: the same auction, the same answer
A good share of the people asking what Facebook ads cost are really asking about Instagram, so settle it here rather than in a second search. There is no separate Instagram price list. Ads on Instagram are bought in the same Meta Ads Manager, inside the same campaigns, and priced by the same auction this article has been describing: Instagram feed, Stories, Explore, and Reels are placements you tick, not products with their own rates. Every formula above and every benchmark caveat applies unchanged, including the absence of any published Malaysian average.
That settles the common follow-up questions quickly. What Instagram ads cost per month is arithmetic, not a tariff: your daily budget multiplied by the days the campaign runs, so RM20 a day comes to about RM600 a month and RM50 a day to about RM1,500, with the auction deciding what those ringgit buy. Instagram Story ads carry no premium of their own, because Stories is one placement among several. So whether Facebook or Instagram ends up cheaper is not something you choose in advance: leave placements automatic and the auction routes your ringgit to whichever surface converts cheapest for your audience that hour.
Boosting a post on Instagram costs the budget you set in the app, above a small minimum shown as you type, and it buys the simplified product: fewer objectives, lighter targeting, the same auction underneath. One genuine pricing difference is worth knowing. Since early 2024, Meta has passed a 30 percent Apple service charge on to advertisers who pay for a boost inside the iOS app, a rollout that began in the US with more markets to follow (Search Engine Land, 2024). Pay for the boost from a desktop browser, or build the ad properly in Ads Manager, and that charge never applies.
What moves your cost, and how much it spikes in season
Season is the loudest variable, and the swing is the single largest predictable move in your cost all year. Shopify measured its US CPM at $16.06 in November 2025 and noted that costs historically climb in the latter months of the year, when Black Friday to Cyber Monday competition crowds the auction (Shopify, 2025). WordStream's data shows the structural pressure beneath the spike: cost per lead rose 21 percent year over year to $27.66 (Search Engine Land, 2025), so each season starts from a higher floor than the last. Those are US figures to verify independently, but the behaviour is exactly what hits the Malaysian feed in the Raya run-up and on the mega-sale dates. The calendar concentrates the pressure into a few windows: the four to six weeks before Raya (fashion labels pushing kurung and sedondon sets, kuih and hamper sellers, telcos, and every store promising delivery before balik kampung), the double-date sales from 9.9 through 12.12 with 11.11 the fiercest, the Merdeka to Malaysia Day corridor through late August and early September, and the year-end school holidays. More bidders, costlier impressions, whether the date reads "Cyber Monday" or "11.11."
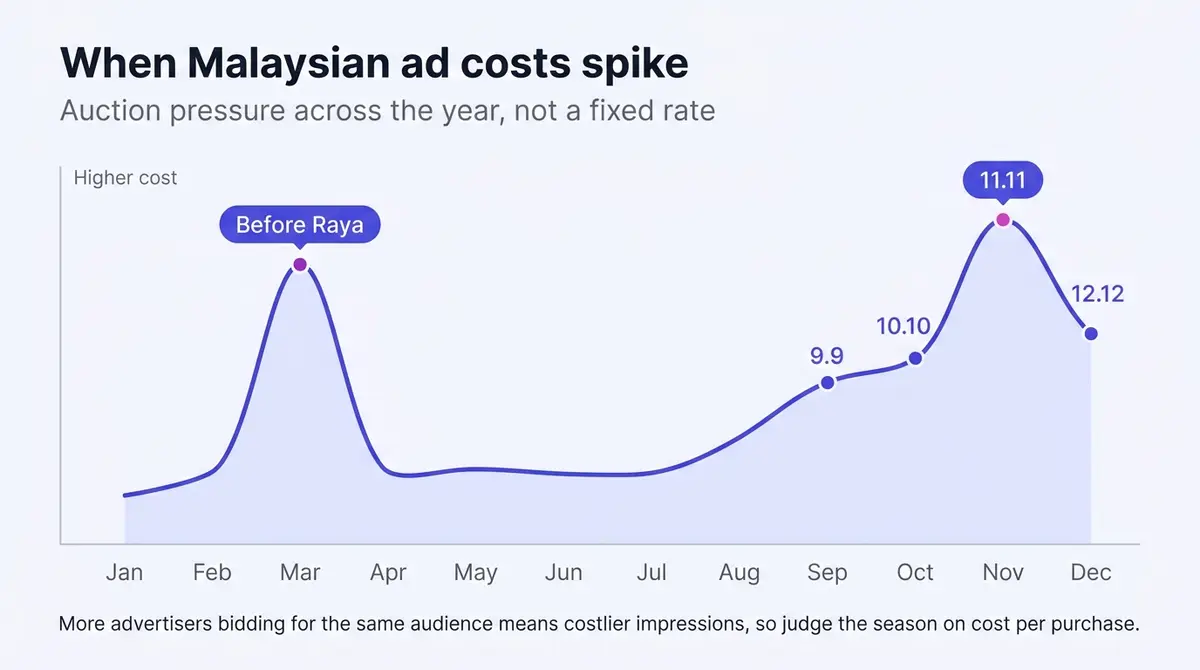
Category and audience set the rest. Crowded verticals (beauty and skincare, modest fashion, supplements) draw more competition than a niche store, the same gradient the vertical table above showed. Automatic placements let Meta shift spend toward cheaper slots across Facebook, Instagram, and Reels, and a broad audience finds inexpensive conversions where a hyper-narrow one pays whatever its few impressions cost. The creative itself, the lever fully in your control, gets its own section below. Three rules carry across the seasonal peaks:
- Launch early so learning finishes before the peak. An ad set needs roughly 50 results in a 7-day window to exit Meta's learning phase. Switch on the night before 11.11 and you pay peak CPMs while the system is still guessing. Start a fixed-window sale 2-3 weeks early; for Raya, warm up 4-6 weeks out, when the pre-Hari Raya bidding is only beginning to build.
- Expect a higher CPM and do not flinch at it. Costlier impressions are not automatically bad news, because buying intent peaks in the very same weeks. A CPM well above your January number can still be your most profitable spend of the year if it converts.
- Judge the season on cost per purchase, not CPM. Season inflates the headline rate; your unit economics decide whether to keep spending.
Your bid strategy is a cost ceiling you choose
The auction sets the price, but you choose how Meta bids into it, the closest thing to a cost dial Ads Manager gives you. Leave the default to start; the manual options are what put a ceiling on cost per result once you know your numbers.
| Bid strategy | What it does | When to reach for it |
|---|---|---|
| Highest volume (lowest cost) | Spends the budget for as many results as possible, no cost limit | The default. Use it to discover your real cost per result first. |
| Cost per result goal (cost cap) | Keeps your average cost per result near a target you set | Once you know your target CPA and want delivery without runaway cost. |
| Bid cap | Hard ceiling on what Meta bids in any single auction | Strict control for experienced buyers; too low a cap throttles delivery. |
| Minimum ROAS | Holds delivery to a return on ad spend you specify | Variable order values, optimizing for revenue rather than sale count. |
The sequence that works for most stores: launch on highest volume so the system finds your true cost, then layer a cost cap roughly at that number if you need to protect margin. A bid cap on day one is the common error; set it below what the auction needs and the ad stops spending.
How to size a Facebook ad budget in ringgit
A daily-spend range is not a budget. RM20 to RM50 a day tells you what you can sustain, not what your goal requires. Size the number properly and you stop guessing. Work through it in five steps, all in ringgit.
- Work backward from a sales target. Decide how many sales (or leads) you need this month, then multiply by a realistic target cost per result. Want 40 purchases at a target RM25 cost per purchase, and your minimum monthly ad budget is about RM1,000, or roughly RM33 a day. The target cost per result is a guess on day one and a measured number by week two.
- Check the budget can buy enough learning. An ad set needs roughly 50 results in 7 days to exit the learning phase (Meta Business Help Center). At a RM25 target, that is about RM1,250 a week to clear learning on purchases. If that is out of reach, optimize for a cheaper upstream event (add-to-cart, landing-page view) so 50 events a week stays affordable while you gather data.
- Sanity-check against revenue. A common practitioner rule of thumb puts the ad budget around 5 to 15 percent of the revenue it is meant to generate. Treat that as a ceiling and a gut check, not a Meta rule: if your math in step 1 lands far outside it, your target cost per result or your sales goal is unrealistic.
- Choose daily or lifetime to match the run. A daily budget suits always-on selling; it is effectively a weekly average, because Meta can spend up to 75 percent over it on a strong day but holds the week within seven times the daily amount (Meta Business Help Center). A lifetime budget hands Meta the whole flight to pace, which fits a fixed window like a Raya push or an 11.11 sale better than an always-on campaign.
- Set the budget at the campaign level by default. Use Advantage Campaign Budget (you may still see the older name, Campaign Budget Optimization or CBO) so the system pushes spend toward whichever ad set performs. Reach for ad-set budgets only when you must guarantee a specific audience or test gets funded.
The minimum budget, and why the first RM200 is tuition
"What is the minimum I can spend" is one of the most-typed questions, and the honest reframe is "how much does it cost to find my number." Meta's technical per-ad-set minimum is tiny and shown in RM as you type, so that is never the real floor. The practical minimum is whatever buys roughly 50 optimization events a week through the learning phase; below that, the system never gathers enough signal and your cost per result stays stuck in expensive guesswork.
That reframes the whole question. Your first two weeks of spend are not the campaign, they are the data purchase that tells you what a result actually costs in your category, this season, for your creative. A store that treats the first RM200 to RM300 as tuition rather than waste makes calmer decisions: it does not kill a campaign on day two, it does not chase a cheap CPM, and it reads cost per result at the end of learning, not the start. Many small Malaysian stores hold RM20 to RM50 a day steady for those two weeks, resisting edits that would restart the phase. The number you are buying is your own benchmark, and no imported figure can hand it to you.
A worked RM example, start to finish
Numbers make this concrete, so follow one store the whole way. A Malaysian skincare brand sells a serum at RM50 and keeps RM30 of margin after cost of goods on each one. It commits a budget it can hold: RM40 a day for 14 days, RM560 total, optimizing for purchases on a cold audience.
First, the ceilings. Break-even ROAS is the selling price divided by the margin kept before ad spend: RM50 divided by RM30 is about 1.67x, so every RM1 of spend must return RM1.67 in sales just to stand still. The maximum it can pay for a purchase is the margin itself, RM30. If the landing page converts 4 of every 100 visitors, the break-even cost per click is that RM30 ceiling times the 4 percent conversion rate, near RM1.20 a click. Those three numbers (1.67x ROAS, RM30 per purchase, RM1.20 per click) are the goalposts before a single ad runs.
Next, the learning check. At a RM30 target cost per purchase, 50 purchases in a week would cost about RM1,500, far more than RM40 a day can buy, so this store optimizes for add-to-cart at first, a cheaper event it can rack up 50 of in a week, then graduates to purchase optimization once the data is in. It holds the ad set steady for two weeks, resisting edits that would restart learning, and reads the report only at the end.
Now the verdict. Suppose the RM560 returns 22 purchases. Cost per purchase is RM560 divided by 22, about RM25.50, comfortably under the RM30 ceiling. Revenue is 22 times RM50, RM1,100 against RM560 spent, a ROAS of about 1.96x, above the 1.67x break-even. The store keeps RM30 of margin on each of 22 sales, RM660, minus the RM560 in ad spend, for roughly RM100 of profit on top of covering the ads. The campaign works, with room to scale. From here the store raises the budget gently, around 10 to 20 percent every few days (a media-buyer rule of thumb, not a Meta-published figure), watching whether cost per purchase holds near RM25.50. The moment it drifts toward RM30, the store has found this audience's ceiling, and the next gain comes from fresh creative or a new audience, not more budget.
Creative is the cost lever you own
Recall how the auction scores you: estimated action rate and ad quality sit next to the bid. Lift them and you pay less for the same audience; let them sag and you subsidize competitors' reach. That makes creative refresh a cost strategy, not a branding nicety. An ad seen too often stops earning clicks, its estimated action rate slides, and the auction quietly charges more per impression. Watch frequency against results: when one rises as the other falls, the ad is fatigued, and the cheapest move is a new angle.
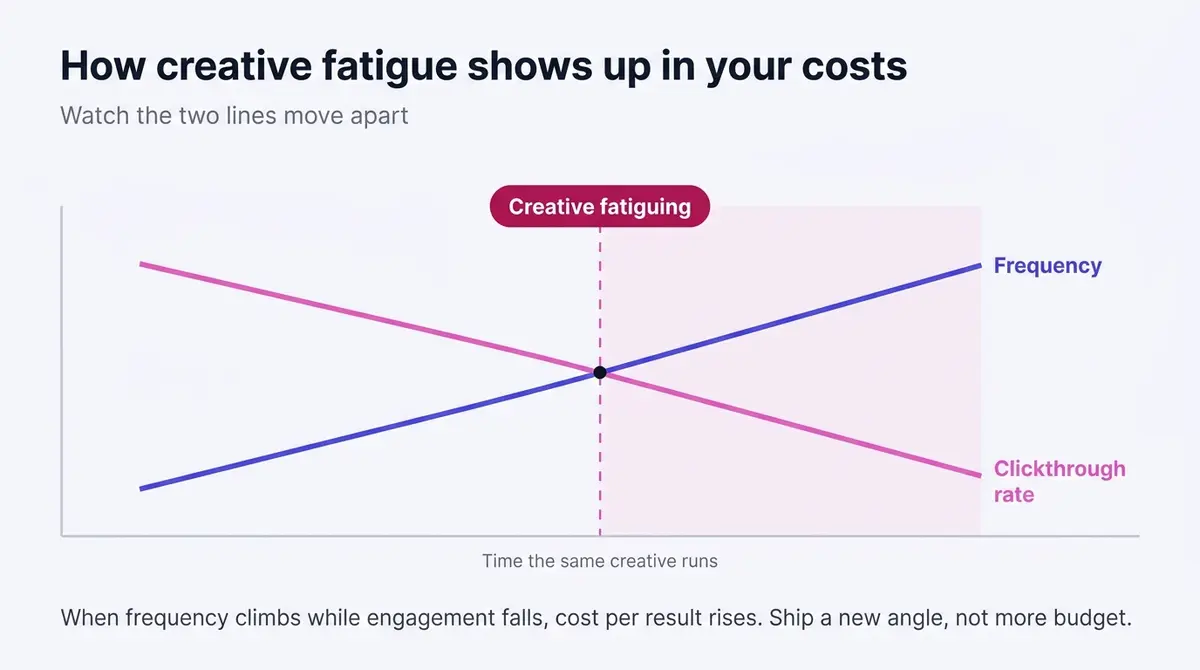
Meta even shows you where that quality stands. Once an ad clears roughly 500 impressions, three ad relevance diagnostics populate in Ads Manager, each rated above average, average, or below average against competing ads: Quality Ranking, Engagement Rate Ranking, and Conversion Rate Ranking. They read like a triage chart. Below-average quality and engagement points at the creative; good engagement but a low conversion ranking points past the ad, at the landing page or offer; all three below average means the whole package is mismatched. Read them before you blame your budget.
One penalty sits above any single ad. Meta runs an account-level Customer Feedback Score from 0 to 5, built from post-purchase surveys to buyers. Drift below 2 and your ads reach fewer people and cost more per impression; near 1 can restrict advertising. For a store that ships slowly, misdescribes products, or ignores complaints, that reputation tax surfaces as higher CPMs across every campaign, however sharp the creative.
Building that refresh pipeline does not require a team. Browse the free Meta Ad Library to see which angles competitors keep running, write two or three genuinely different hooks instead of three crops of the same image, and put short vertical video in the mix. Tools that keep research, generation, and editing in one place, AdPlay.ai among them, shorten each cycle, but the principle holds with any workflow: the store that ships a fresh test every week or two pays less per result over a quarter than the one that rode a March winner into the ground.
What to do this week, and what to avoid
Most overspending in a small account traces back to the same handful of habits, so clear these before you launch.
- Underfunding the ad set. Too small to buy roughly 50 results a week, it never exits the learning phase and stays in expensive guesswork.
- Splitting the budget too thin. Five starved ad sets lose to one properly funded one, because none gathers enough signal to optimize.
- Editing mid-learning. Significant edits to budget, audience, or creative restart the phase and waste the spend that got you partway.
- Judging on CPM or day-two data. A cheap CPM that does not convert is not a win, and two days is not a verdict.
- Launching seasonal creative late. Starting the night before 11.11 means paying peak prices while the system is still learning.
- Treating budget as the cost lever. When cost per result is too high, more budget rarely fixes it. Creative, offer, and landing page do.
With those out of the way, leave with a process, because the process produces your number. Set the campaign up properly (the step-by-step walkthrough covers objectives, budgets, and publishing), pick a daily budget in RM you can hold for two weeks, launch three genuinely different creatives, and watch through the learning phase. At the end you will hold what no benchmark article can give you: your CPM, your CPC, and your cost per result, for your product, this market, this season. The US studies and the local RM ranges both become a once-a-year curiosity after that. Your Ads Manager quotes Malaysia's real prices daily.
By the numbers
Frequently asked questions
How much should a small Malaysian business spend on Facebook ads per month?
Work backward from a goal, not from a fixed figure. Decide how many sales or leads you need this month, multiply by a realistic target cost per result, and that is your minimum monthly budget: 40 purchases at a target RM25 each is about RM1,000 a month, or roughly RM33 a day. Then check the budget can buy roughly 50 optimization events a week so the ad set exits Meta's learning phase, and sanity-check the total against revenue (a common practitioner rule of thumb is 5 to 15 percent of the revenue the ads should generate, treated as a ceiling, not a Meta rule). Many small stores start in the RM20 to RM50 a day range and adjust once they see their real cost per result.
What is a good CPM in Malaysia, and why is it cheaper than the US?
Meta publishes no Malaysian CPM and no neutral third party measures one, so the honest answer is that a good CPM is one your own Ads Manager reports as stable while your cost per result stays inside your margin. Local agency guides do quote ringgit, and the bands run from RM8 to RM25 (MediaPlus Digital, January 2026) to RM8 to RM35 (OpenMinds Resources, July 2026) and RM10 to RM50 (Iffah Ishak, March 2025). None names a dataset, so treat them as practitioner estimates from client books: a sanity band, not a target. What the dated data does establish is the US level, with Shopify putting the average US CPM at $16.06 in November 2025. Malaysian CPMs sit below figures like that because the auction has fewer advertisers bidding in a lower-spend market, so each thousand impressions clears cheaper. Launch, and read your own CPM as the only rate that is actually yours.
How much do Facebook ads cost per lead in Malaysia?
No neutral source measures a Malaysian cost per lead. Local agencies publish bands from their own client books, for example RM8 to RM80 across categories (OpenMinds Resources, July 2026) and RM3 to RM10 for F&B rising to RM50 to RM150 for finance and insurance (MediaPlus Digital, January 2026), which is a useful spread to know and an unauditable one, since neither guide names a dataset. The measured reference is US data, with the caveat that your ringgit figure will be lower because local CPMs sit well below US ones: WordStream's 2025 study put the US average cost per lead at $27.66, ranging from about $3.16 for restaurants and food to $76.71 for dental services. Notice that both the US study and the local estimates order the categories the same way, so the gradient is the reliable part and the figure is not. Optimize a lead campaign, run it for two weeks, and read your own cost per lead in RM, which is the only one that fits your offer.
Do Facebook ad costs in Malaysia really spike during Raya and 11.11, and by how much?
Yes, because auctions are sold to the highest competition, and those windows pack the most advertisers into the same feed. There is no published Malaysian percentage, but the dynamic is the same one Shopify documents in the US, where it notes that costs historically climb in the latter months of the year as Black Friday and Cyber Monday competition crowds the auction. Expect noticeably higher CPMs in the four to six weeks before Hari Raya and around the 9.9 to 12.12 mega-sales. The fix is timing: launch a seasonal campaign 2-3 weeks early (4-6 weeks for Raya) so learning finishes before the peak, and judge the season on cost per purchase, since buying intent rises in the very same weeks.
Is RM20 a day enough to run Facebook ads in Malaysia?
It can be, for a single ad set optimizing a cheaper event like landing-page views or add-to-carts, but it is tight for purchase optimization. The real test is whether the budget can buy roughly 50 optimization events a week, which is what Meta's learning phase needs. RM20 a day is RM140 a week; if your cost per result is around RM3, that clears the bar, but if you are chasing RM25 purchases it does not. Start with a number you can hold steady for two weeks, optimize for the cheapest event that still matters to your funnel, and read cost per result at the end before deciding whether to add budget.
Why are my Facebook CPMs higher than the benchmarks I read online?
Usually because the benchmark is the wrong comparison. Most figures online are US data, where CPMs run several times higher than Malaysia, so an imported number is not a fair target either way. Within your own account, a high CPM points at a few things: a narrow audience the auction cannot fill cheaply, a crowded category or season, or creative that is fatiguing (check whether frequency is climbing while clickthrough falls). Meta's three ad relevance diagnostics in Ads Manager (Quality, Engagement Rate and Conversion Rate Ranking) show whether the creative is the drag. A below-average quality ranking quietly raises what you pay per impression.
How do I work out a profitable cost per purchase in ringgit for my store?
Start from your margin. If you sell at RM50 and keep RM30 after cost of goods, then RM30 is the most you can pay for a purchase and still break even, and your break-even ROAS is RM50 divided by RM30, about 1.67x. A profitable cost per purchase is any number below that RM30 ceiling. To get a click target, multiply the cost-per-purchase ceiling by your landing-page conversion rate: at 4 percent, a RM30 ceiling implies a break-even click near RM1.20. Those ceilings, built on your own price and margin, are the only ones that decide whether a cost is affordable. A benchmark from another market cannot.
Are Facebook ads or Instagram ads cheaper in Malaysia?
Neither is cheaper by rule, because they share one auction. Instagram ads are bought in the same Meta Ads Manager and priced by the same auction as Facebook ads, with Instagram feed, Stories, Explore and Reels as placements you tick rather than products with their own rates. Leave placements on automatic and Meta routes your ringgit to whichever surface delivers your result cheapest at that hour, so the cheaper one changes by audience, creative and time of day. The only Instagram-specific cost to avoid is the 30 percent Apple service charge on boosts paid inside the iOS app; pay from a desktop browser or build the ad in Ads Manager and it never applies.
Sources
- 1.WordStream, Facebook Ads Benchmarks 2025 (2025)
- 2.Search Engine Land, Facebook Ad Costs Jump 21% in 2025 (2025)
- 3.Shopify, What Facebook Ads Cost in November 2025 (2025)
- 4.DataReportal, Digital 2026: Malaysia (2026)
- 5.AdPlay.ai, analysis of 679,800 Malaysian Meta ads (2026)
- 6.Meta Business Help Center, About the Learning Phase (2026)
- 7.Meta Business Help Center, About Ad Relevance Diagnostics (2026)
- 8.Meta Business Help Center, About Cost and Bid Controls (2026)
- 9.Meta Business Help Center, About Budget (Daily, Lifetime and Advantage Campaign Budget) (2026)
- 10.Meta Business Help Center, About Daily Budgets (2026)
- 11.Meta Business Help Center, Best Practices for Positive Customer Feedback (2026)
- 12.Meta Business Help Center, How Meta Charges for Ads (2026)
- 13.Search Engine Land, Meta Advertisers Can Avoid 30% Apple Service Charge for Boosted Posts (2024)
Keep exploring
Turn ad research into winning ads
See what 16,000 Malaysian brands advertise, then generate on-brand creative, all in one tool.
7-day free trial · No credit card required